|
Download Data (XLS File) |
|
|||||
|
|||||
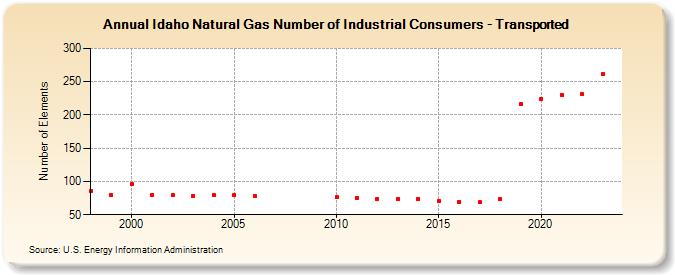
| Idaho Natural Gas Number of Industrial Consumers - Transported (Number of Elements) | |||||
| Decade | Year-0 | Year-1 | Year-2 | Year-3 | Year-4 | Year-5 | Year-6 | Year-7 | Year-8 | Year-9 |
|---|---|---|---|---|---|---|---|---|---|---|
| 1990's | 86 | 79 | ||||||||
| 2000's | 96 | 80 | 80 | 78 | 79 | 79 | 78 | |||
| 2010's | 76 | 75 | 74 | 74 | 74 | 70 | 69 | 69 | 73 | 216 |
| 2020's | 224 | 230 | 231 | 261 | 278 |
| - = No Data Reported; -- = Not Applicable; NA = Not Available; W = Withheld to avoid disclosure of individual company data. |
| Release Date: 6/30/2026 |
| Next Release Date: 7/31/2026 |