|
Download Data (XLS File) |
|
|||||
|
|||||
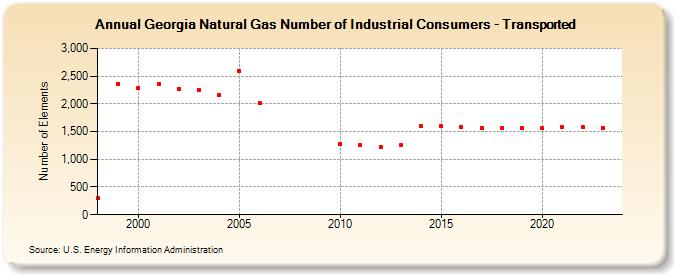
| Georgia Natural Gas Number of Industrial Consumers - Transported (Number of Elements) | |||||
| Decade | Year-0 | Year-1 | Year-2 | Year-3 | Year-4 | Year-5 | Year-6 | Year-7 | Year-8 | Year-9 |
|---|---|---|---|---|---|---|---|---|---|---|
| 1990's | 295 | 2,353 | ||||||||
| 2000's | 2,284 | 2,363 | 2,276 | 2,248 | 2,168 | 2,600 | 2,011 | |||
| 2010's | 1,282 | 1,256 | 1,226 | 1,258 | 1,594 | 1,597 | 1,576 | 1,569 | 1,565 | 1,561 |
| 2020's | 1,558 | 1,574 | 1,575 | 1,572 | 1,559 |
| - = No Data Reported; -- = Not Applicable; NA = Not Available; W = Withheld to avoid disclosure of individual company data. |
| Release Date: 6/30/2026 |
| Next Release Date: 7/31/2026 |