|
Download Data (XLS File) |
|
|||||
|
|||||
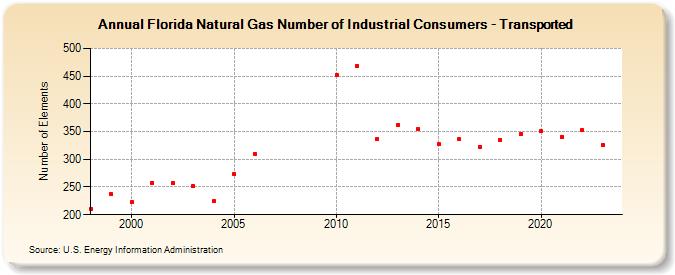
| Florida Natural Gas Number of Industrial Consumers - Transported (Number of Elements) | |||||
| Decade | Year-0 | Year-1 | Year-2 | Year-3 | Year-4 | Year-5 | Year-6 | Year-7 | Year-8 | Year-9 |
|---|---|---|---|---|---|---|---|---|---|---|
| 1990's | 211 | 237 | ||||||||
| 2000's | 223 | 258 | 258 | 252 | 224 | 273 | 310 | |||
| 2010's | 452 | 468 | 337 | 362 | 355 | 327 | 336 | 323 | 335 | 345 |
| 2020's | 351 | 341 | 352 | 326 | 278 |
| - = No Data Reported; -- = Not Applicable; NA = Not Available; W = Withheld to avoid disclosure of individual company data. |
| Release Date: 6/30/2026 |
| Next Release Date: 7/31/2026 |