|
Download Data (XLS File) |
|
|||||
|
|||||
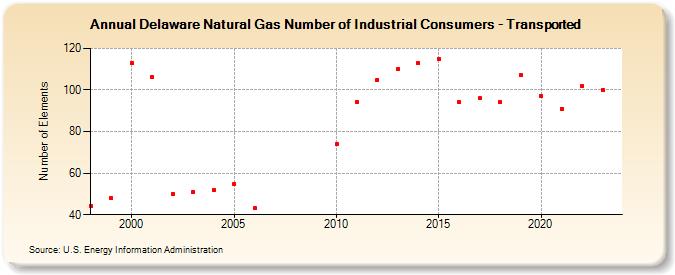
| Delaware Natural Gas Number of Industrial Consumers - Transported (Number of Elements) | |||||
| Decade | Year-0 | Year-1 | Year-2 | Year-3 | Year-4 | Year-5 | Year-6 | Year-7 | Year-8 | Year-9 |
|---|---|---|---|---|---|---|---|---|---|---|
| 1990's | 44 | 48 | ||||||||
| 2000's | 113 | 106 | 50 | 51 | 52 | 55 | 43 | |||
| 2010's | 74 | 94 | 105 | 110 | 113 | 115 | 94 | 96 | 94 | 107 |
| 2020's | 97 | 91 | 102 | 100 | 99 |
| - = No Data Reported; -- = Not Applicable; NA = Not Available; W = Withheld to avoid disclosure of individual company data. |
| Release Date: 6/30/2026 |
| Next Release Date: 7/31/2026 |