|
Download Data (XLS File) |
|
|||||
|
|||||
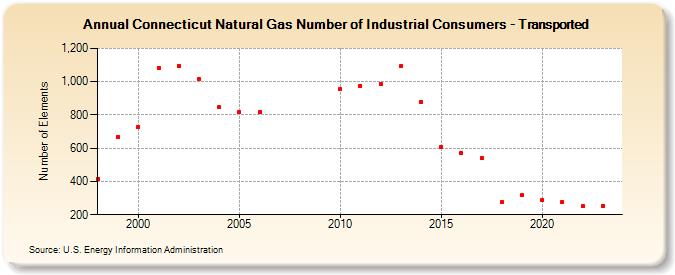
| Connecticut Natural Gas Number of Industrial Consumers - Transported (Number of Elements) | |||||
| Decade | Year-0 | Year-1 | Year-2 | Year-3 | Year-4 | Year-5 | Year-6 | Year-7 | Year-8 | Year-9 |
|---|---|---|---|---|---|---|---|---|---|---|
| 1990's | 416 | 669 | ||||||||
| 2000's | 730 | 1,085 | 1,096 | 1,013 | 845 | 819 | 818 | |||
| 2010's | 953 | 976 | 986 | 1,094 | 877 | 610 | 569 | 540 | 275 | 316 |
| 2020's | 289 | 275 | 250 | 251 | 260 |
| - = No Data Reported; -- = Not Applicable; NA = Not Available; W = Withheld to avoid disclosure of individual company data. |
| Release Date: 6/30/2026 |
| Next Release Date: 7/31/2026 |