|
Download Data (XLS File) |
|
|||||
|
|||||
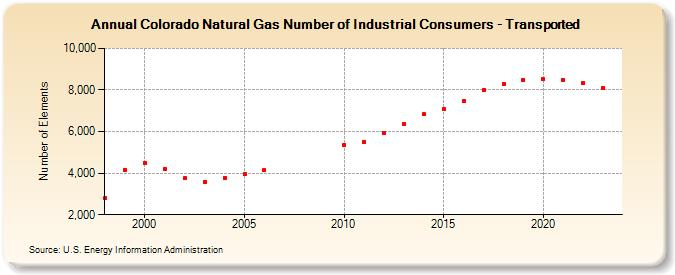
| Colorado Natural Gas Number of Industrial Consumers - Transported (Number of Elements) | |||||
| Decade | Year-0 | Year-1 | Year-2 | Year-3 | Year-4 | Year-5 | Year-6 | Year-7 | Year-8 | Year-9 |
|---|---|---|---|---|---|---|---|---|---|---|
| 1990's | 2,784 | 4,164 | ||||||||
| 2000's | 4,474 | 4,175 | 3,746 | 3,565 | 3,782 | 3,954 | 4,138 | |||
| 2010's | 5,350 | 5,518 | 5,946 | 6,347 | 6,837 | 7,076 | 7,483 | 8,008 | 8,281 | 8,492 |
| 2020's | 8,519 | 8,489 | 8,336 | 8,116 | 7,865 |
| - = No Data Reported; -- = Not Applicable; NA = Not Available; W = Withheld to avoid disclosure of individual company data. |
| Release Date: 6/30/2026 |
| Next Release Date: 7/31/2026 |