|
Download Data (XLS File) |
|
|||||
|
|||||
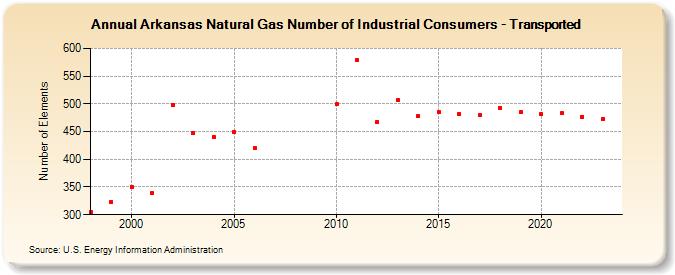
| Arkansas Natural Gas Number of Industrial Consumers - Transported (Number of Elements) | |||||
| Decade | Year-0 | Year-1 | Year-2 | Year-3 | Year-4 | Year-5 | Year-6 | Year-7 | Year-8 | Year-9 |
|---|---|---|---|---|---|---|---|---|---|---|
| 1990's | 305 | 323 | ||||||||
| 2000's | 350 | 339 | 497 | 447 | 441 | 449 | 420 | |||
| 2010's | 499 | 579 | 467 | 507 | 478 | 485 | 482 | 479 | 493 | 485 |
| 2020's | 481 | 483 | 477 | 473 | 482 |
| - = No Data Reported; -- = Not Applicable; NA = Not Available; W = Withheld to avoid disclosure of individual company data. |
| Release Date: 6/30/2026 |
| Next Release Date: 7/31/2026 |