|
Download Data (XLS File) |
|
|||||
|
|||||
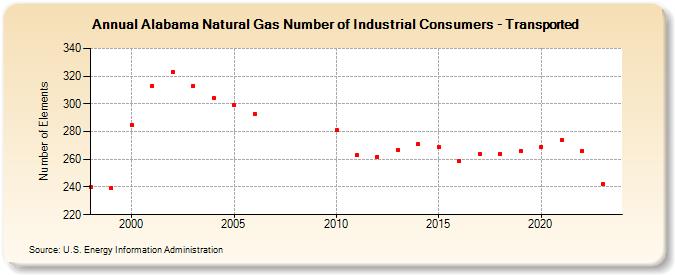
| Alabama Natural Gas Number of Industrial Consumers - Transported (Number of Elements) | |||||
| Decade | Year-0 | Year-1 | Year-2 | Year-3 | Year-4 | Year-5 | Year-6 | Year-7 | Year-8 | Year-9 |
|---|---|---|---|---|---|---|---|---|---|---|
| 1990's | 240 | 239 | ||||||||
| 2000's | 285 | 313 | 323 | 313 | 304 | 299 | 293 | |||
| 2010's | 281 | 263 | 262 | 267 | 271 | 269 | 259 | 264 | 264 | 266 |
| 2020's | 269 | 274 | 266 | 242 | 243 |
| - = No Data Reported; -- = Not Applicable; NA = Not Available; W = Withheld to avoid disclosure of individual company data. |
| Release Date: 6/30/2026 |
| Next Release Date: 7/31/2026 |