|
Download Data (XLS File) |
|
|||||
|
|||||
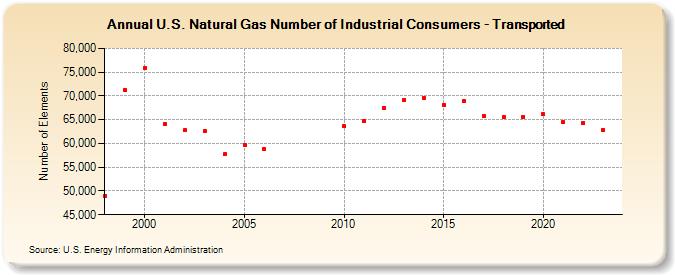
| U.S. Natural Gas Number of Industrial Consumers - Transported (Number of Elements) | |||||
| Decade | Year-0 | Year-1 | Year-2 | Year-3 | Year-4 | Year-5 | Year-6 | Year-7 | Year-8 | Year-9 |
|---|---|---|---|---|---|---|---|---|---|---|
| 1990's | 49,014 | 71,281 | ||||||||
| 2000's | 75,826 | 64,052 | 62,738 | 62,698 | 57,672 | 59,773 | 58,760 | |||
| 2010's | 63,611 | 64,749 | 67,551 | 69,164 | 69,637 | 68,146 | 68,869 | 65,756 | 65,614 | 65,593 |
| 2020's | 66,127 | 64,457 | 64,329 | 62,926 | 62,673 |
| - = No Data Reported; -- = Not Applicable; NA = Not Available; W = Withheld to avoid disclosure of individual company data. |
| Release Date: 6/30/2026 |
| Next Release Date: 7/31/2026 |