|
Download Data (XLS File) |
|
|||||
|
|||||
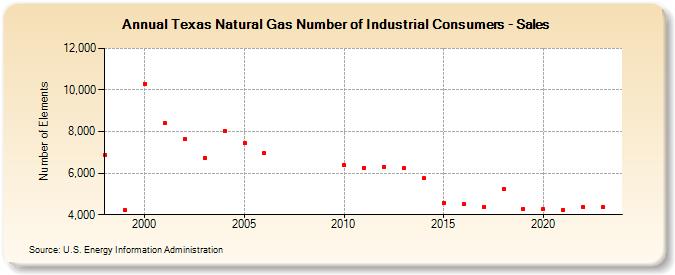
| Texas Natural Gas Number of Industrial Consumers - Sales (Number of Elements) | |||||
| Decade | Year-0 | Year-1 | Year-2 | Year-3 | Year-4 | Year-5 | Year-6 | Year-7 | Year-8 | Year-9 |
|---|---|---|---|---|---|---|---|---|---|---|
| 1990's | 6,887 | 4,206 | ||||||||
| 2000's | 10,302 | 8,419 | 7,618 | 6,746 | 8,037 | 7,434 | 6,954 | |||
| 2010's | 6,391 | 6,268 | 6,302 | 6,234 | 5,760 | 4,586 | 4,508 | 4,383 | 5,244 | 4,285 |
| 2020's | 4,265 | 4,237 | 4,382 | 4,187 | 4,865 |
| - = No Data Reported; -- = Not Applicable; NA = Not Available; W = Withheld to avoid disclosure of individual company data. |
| Release Date: 6/30/2026 |
| Next Release Date: 7/31/2026 |