|
Download Data (XLS File) |
|
|||||
|
|||||
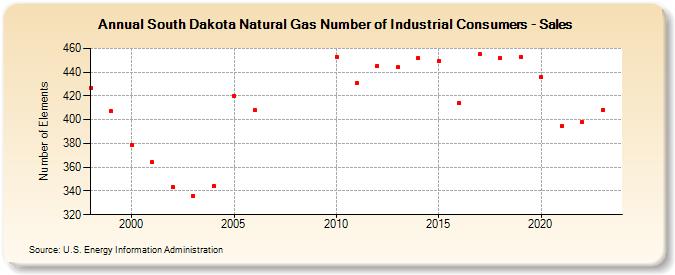
| South Dakota Natural Gas Number of Industrial Consumers - Sales (Number of Elements) | |||||
| Decade | Year-0 | Year-1 | Year-2 | Year-3 | Year-4 | Year-5 | Year-6 | Year-7 | Year-8 | Year-9 |
|---|---|---|---|---|---|---|---|---|---|---|
| 1990's | 427 | 407 | ||||||||
| 2000's | 379 | 364 | 343 | 336 | 344 | 420 | 408 | |||
| 2010's | 453 | 431 | 445 | 444 | 452 | 449 | 414 | 455 | 452 | 453 |
| 2020's | 436 | 395 | 398 | 408 | 412 |
| - = No Data Reported; -- = Not Applicable; NA = Not Available; W = Withheld to avoid disclosure of individual company data. |
| Release Date: 6/30/2026 |
| Next Release Date: 7/31/2026 |