|
Download Data (XLS File) |
|
|||||
|
|||||
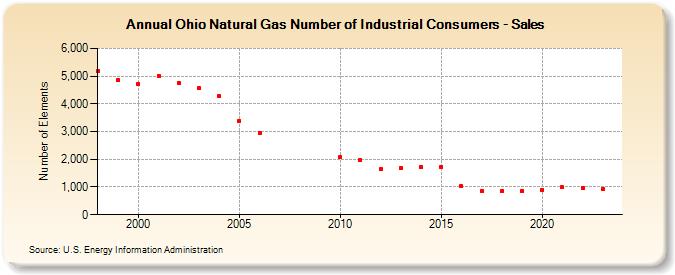
| Ohio Natural Gas Number of Industrial Consumers - Sales (Number of Elements) | |||||
| Decade | Year-0 | Year-1 | Year-2 | Year-3 | Year-4 | Year-5 | Year-6 | Year-7 | Year-8 | Year-9 |
|---|---|---|---|---|---|---|---|---|---|---|
| 1990's | 5,197 | 4,860 | ||||||||
| 2000's | 4,729 | 5,010 | 4,761 | 4,561 | 4,273 | 3,388 | 2,946 | |||
| 2010's | 2,065 | 1,970 | 1,634 | 1,686 | 1,714 | 1,736 | 1,030 | 858 | 868 | 873 |
| 2020's | 900 | 982 | 981 | 917 | 1,229 |
| - = No Data Reported; -- = Not Applicable; NA = Not Available; W = Withheld to avoid disclosure of individual company data. |
| Release Date: 6/30/2026 |
| Next Release Date: 7/31/2026 |