|
Download Data (XLS File) |
|
|||||
|
|||||
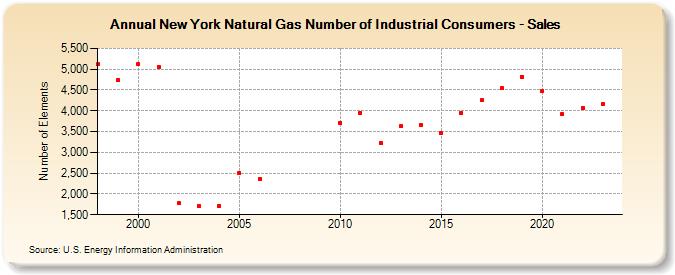
| New York Natural Gas Number of Industrial Consumers - Sales (Number of Elements) | |||||
| Decade | Year-0 | Year-1 | Year-2 | Year-3 | Year-4 | Year-5 | Year-6 | Year-7 | Year-8 | Year-9 |
|---|---|---|---|---|---|---|---|---|---|---|
| 1990's | 5,115 | 4,740 | ||||||||
| 2000's | 5,118 | 5,060 | 1,772 | 1,712 | 1,708 | 2,494 | 2,370 | |||
| 2010's | 3,712 | 3,954 | 3,231 | 3,632 | 3,658 | 3,457 | 3,955 | 4,251 | 4,543 | 4,822 |
| 2020's | 4,475 | 3,920 | 4,066 | 4,159 | 4,198 |
| - = No Data Reported; -- = Not Applicable; NA = Not Available; W = Withheld to avoid disclosure of individual company data. |
| Release Date: 6/30/2026 |
| Next Release Date: 7/31/2026 |