|
Download Data (XLS File) |
|
|||||
|
|||||
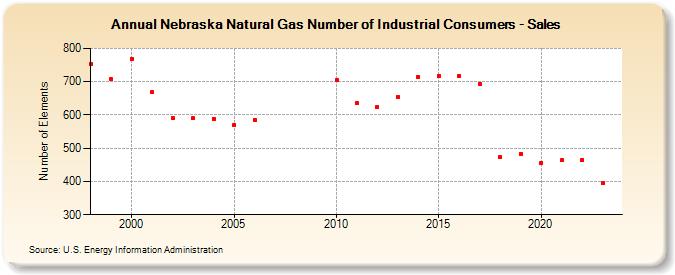
| Nebraska Natural Gas Number of Industrial Consumers - Sales (Number of Elements) | |||||
| Decade | Year-0 | Year-1 | Year-2 | Year-3 | Year-4 | Year-5 | Year-6 | Year-7 | Year-8 | Year-9 |
|---|---|---|---|---|---|---|---|---|---|---|
| 1990's | 753 | 707 | ||||||||
| 2000's | 769 | 668 | 592 | 590 | 589 | 571 | 586 | |||
| 2010's | 705 | 635 | 624 | 655 | 714 | 717 | 717 | 693 | 473 | 484 |
| 2020's | 455 | 463 | 465 | 396 | 379 |
| - = No Data Reported; -- = Not Applicable; NA = Not Available; W = Withheld to avoid disclosure of individual company data. |
| Release Date: 6/30/2026 |
| Next Release Date: 7/31/2026 |