|
Download Data (XLS File) |
|
|||||
|
|||||
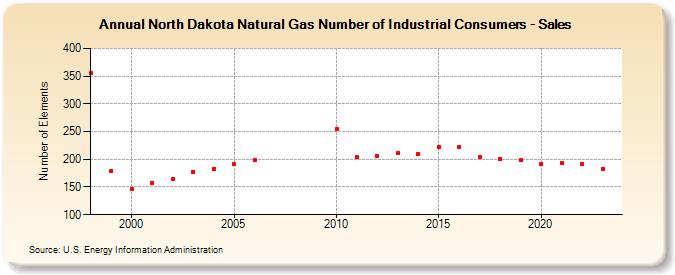
| North Dakota Natural Gas Number of Industrial Consumers - Sales (Number of Elements) | |||||
| Decade | Year-0 | Year-1 | Year-2 | Year-3 | Year-4 | Year-5 | Year-6 | Year-7 | Year-8 | Year-9 |
|---|---|---|---|---|---|---|---|---|---|---|
| 1990's | 355 | 179 | ||||||||
| 2000's | 147 | 157 | 165 | 177 | 183 | 191 | 198 | |||
| 2010's | 255 | 204 | 206 | 211 | 210 | 223 | 222 | 205 | 201 | 198 |
| 2020's | 192 | 193 | 192 | 183 | 176 |
| - = No Data Reported; -- = Not Applicable; NA = Not Available; W = Withheld to avoid disclosure of individual company data. |
| Release Date: 6/30/2026 |
| Next Release Date: 7/31/2026 |