|
Download Data (XLS File) |
|
|||||
|
|||||
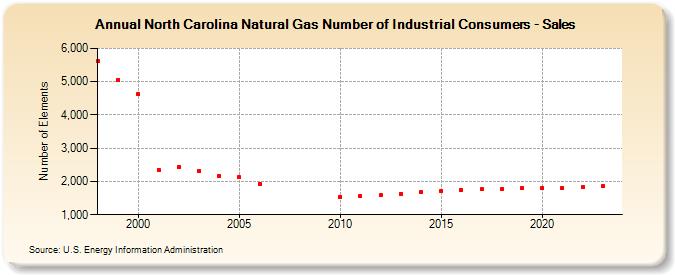
| North Carolina Natural Gas Number of Industrial Consumers - Sales (Number of Elements) | |||||
| Decade | Year-0 | Year-1 | Year-2 | Year-3 | Year-4 | Year-5 | Year-6 | Year-7 | Year-8 | Year-9 |
|---|---|---|---|---|---|---|---|---|---|---|
| 1990's | 5,612 | 5,063 | ||||||||
| 2000's | 4,621 | 2,351 | 2,448 | 2,322 | 2,176 | 2,120 | 1,928 | |||
| 2010's | 1,546 | 1,555 | 1,580 | 1,631 | 1,668 | 1,716 | 1,751 | 1,758 | 1,766 | 1,790 |
| 2020's | 1,805 | 1,797 | 1,829 | 1,851 | 1,867 |
| - = No Data Reported; -- = Not Applicable; NA = Not Available; W = Withheld to avoid disclosure of individual company data. |
| Release Date: 6/30/2026 |
| Next Release Date: 7/31/2026 |