|
Download Data (XLS File) |
|
|||||
|
|||||
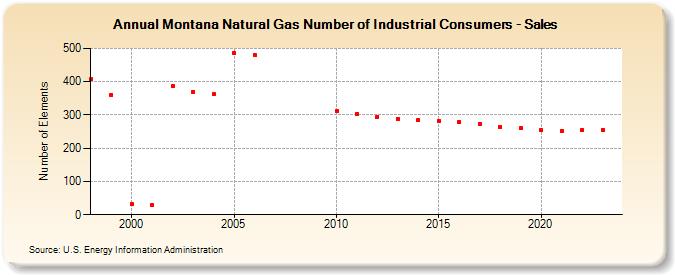
| Montana Natural Gas Number of Industrial Consumers - Sales (Number of Elements) | |||||
| Decade | Year-0 | Year-1 | Year-2 | Year-3 | Year-4 | Year-5 | Year-6 | Year-7 | Year-8 | Year-9 |
|---|---|---|---|---|---|---|---|---|---|---|
| 1990's | 407 | 361 | ||||||||
| 2000's | 31 | 29 | 387 | 370 | 362 | 487 | 480 | |||
| 2010's | 312 | 304 | 295 | 289 | 285 | 283 | 280 | 273 | 265 | 261 |
| 2020's | 254 | 253 | 256 | 256 | 264 |
| - = No Data Reported; -- = Not Applicable; NA = Not Available; W = Withheld to avoid disclosure of individual company data. |
| Release Date: 6/30/2026 |
| Next Release Date: 7/31/2026 |