|
Download Data (XLS File) |
|
|||||
|
|||||
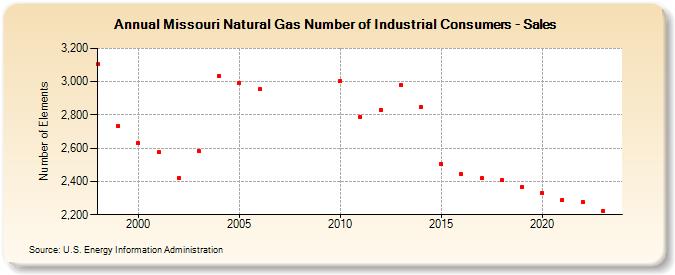
| Missouri Natural Gas Number of Industrial Consumers - Sales (Number of Elements) | |||||
| Decade | Year-0 | Year-1 | Year-2 | Year-3 | Year-4 | Year-5 | Year-6 | Year-7 | Year-8 | Year-9 |
|---|---|---|---|---|---|---|---|---|---|---|
| 1990's | 3,105 | 2,735 | ||||||||
| 2000's | 2,629 | 2,575 | 2,420 | 2,581 | 3,035 | 2,994 | 2,954 | |||
| 2010's | 3,005 | 2,790 | 2,831 | 2,981 | 2,849 | 2,504 | 2,442 | 2,418 | 2,408 | 2,368 |
| 2020's | 2,331 | 2,290 | 2,276 | 2,225 | 2,225 |
| - = No Data Reported; -- = Not Applicable; NA = Not Available; W = Withheld to avoid disclosure of individual company data. |
| Release Date: 6/30/2026 |
| Next Release Date: 7/31/2026 |