|
Download Data (XLS File) |
|
|||||
|
|||||
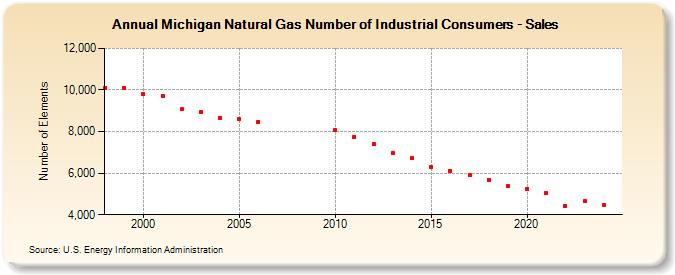
| Michigan Natural Gas Number of Industrial Consumers - Sales (Number of Elements) | |||||
| Decade | Year-0 | Year-1 | Year-2 | Year-3 | Year-4 | Year-5 | Year-6 | Year-7 | Year-8 | Year-9 |
|---|---|---|---|---|---|---|---|---|---|---|
| 1990's | 10,095 | 10,111 | ||||||||
| 2000's | 9,797 | 9,729 | 9,062 | 8,936 | 8,669 | 8,600 | 8,482 | |||
| 2010's | 8,074 | 7,759 | 7,406 | 6,967 | 6,712 | 6,305 | 6,125 | 5,895 | 5,676 | 5,382 |
| 2020's | 5,256 | 5,040 | 4,434 | 4,642 | 4,469 |
| - = No Data Reported; -- = Not Applicable; NA = Not Available; W = Withheld to avoid disclosure of individual company data. |
| Release Date: 6/30/2026 |
| Next Release Date: 7/31/2026 |