|
Download Data (XLS File) |
|
|||||
|
|||||
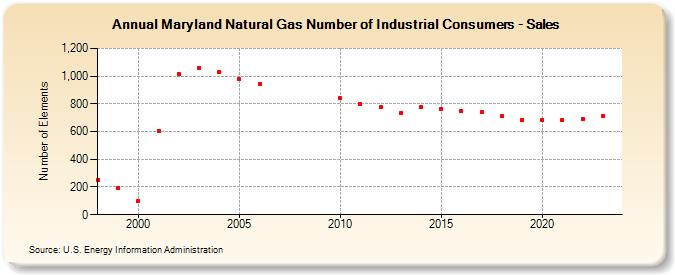
| Maryland Natural Gas Number of Industrial Consumers - Sales (Number of Elements) | |||||
| Decade | Year-0 | Year-1 | Year-2 | Year-3 | Year-4 | Year-5 | Year-6 | Year-7 | Year-8 | Year-9 |
|---|---|---|---|---|---|---|---|---|---|---|
| 1990's | 250 | 193 | ||||||||
| 2000's | 98 | 607 | 1,014 | 1,060 | 1,033 | 976 | 943 | |||
| 2010's | 841 | 797 | 776 | 735 | 776 | 766 | 746 | 741 | 709 | 686 |
| 2020's | 682 | 681 | 694 | 709 | 693 |
| - = No Data Reported; -- = Not Applicable; NA = Not Available; W = Withheld to avoid disclosure of individual company data. |
| Release Date: 6/30/2026 |
| Next Release Date: 7/31/2026 |