|
Download Data (XLS File) |
|
|||||
|
|||||
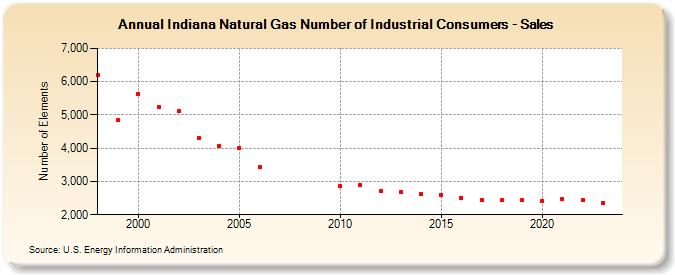
| Indiana Natural Gas Number of Industrial Consumers - Sales (Number of Elements) | |||||
| Decade | Year-0 | Year-1 | Year-2 | Year-3 | Year-4 | Year-5 | Year-6 | Year-7 | Year-8 | Year-9 |
|---|---|---|---|---|---|---|---|---|---|---|
| 1990's | 6,194 | 4,848 | ||||||||
| 2000's | 5,638 | 5,239 | 5,114 | 4,307 | 4,059 | 4,011 | 3,435 | |||
| 2010's | 2,858 | 2,893 | 2,719 | 2,688 | 2,617 | 2,588 | 2,496 | 2,457 | 2,446 | 2,432 |
| 2020's | 2,420 | 2,464 | 2,438 | 2,356 | 2,302 |
| - = No Data Reported; -- = Not Applicable; NA = Not Available; W = Withheld to avoid disclosure of individual company data. |
| Release Date: 6/30/2026 |
| Next Release Date: 7/31/2026 |