|
Download Data (XLS File) |
|
|||||
|
|||||
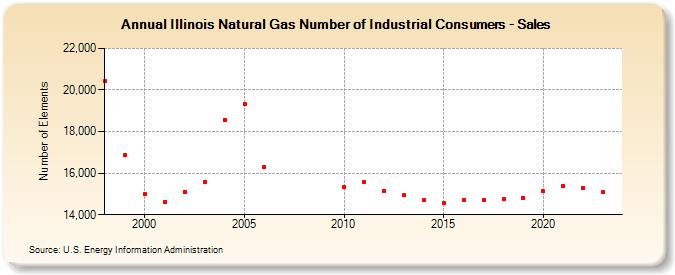
| Illinois Natural Gas Number of Industrial Consumers - Sales (Number of Elements) | |||||
| Decade | Year-0 | Year-1 | Year-2 | Year-3 | Year-4 | Year-5 | Year-6 | Year-7 | Year-8 | Year-9 |
|---|---|---|---|---|---|---|---|---|---|---|
| 1990's | 20,435 | 16,878 | ||||||||
| 2000's | 14,990 | 14,614 | 15,113 | 15,597 | 18,579 | 19,315 | 16,319 | |||
| 2010's | 15,314 | 15,554 | 15,132 | 14,932 | 14,703 | 14,541 | 14,696 | 14,720 | 14,741 | 14,808 |
| 2020's | 15,123 | 15,389 | 15,288 | 15,064 | 14,959 |
| - = No Data Reported; -- = Not Applicable; NA = Not Available; W = Withheld to avoid disclosure of individual company data. |
| Release Date: 6/30/2026 |
| Next Release Date: 7/31/2026 |