|
Download Data (XLS File) |
|
|||||
|
|||||
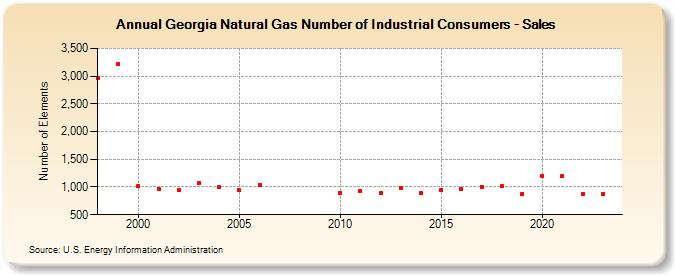
| Georgia Natural Gas Number of Industrial Consumers - Sales (Number of Elements) | |||||
| Decade | Year-0 | Year-1 | Year-2 | Year-3 | Year-4 | Year-5 | Year-6 | Year-7 | Year-8 | Year-9 |
|---|---|---|---|---|---|---|---|---|---|---|
| 1990's | 2,968 | 3,227 | ||||||||
| 2000's | 1,010 | 967 | 943 | 1,078 | 993 | 943 | 1,042 | |||
| 2010's | 892 | 928 | 886 | 984 | 887 | 952 | 966 | 1,008 | 1,010 | 871 |
| 2020's | 1,205 | 1,198 | 875 | 860 | 874 |
| - = No Data Reported; -- = Not Applicable; NA = Not Available; W = Withheld to avoid disclosure of individual company data. |
| Release Date: 6/30/2026 |
| Next Release Date: 7/31/2026 |