|
Download Data (XLS File) |
|
|||||
|
|||||
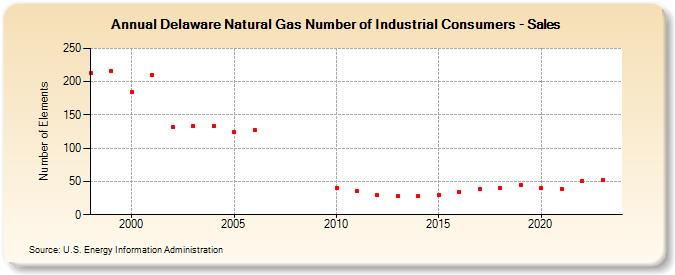
| Delaware Natural Gas Number of Industrial Consumers - Sales (Number of Elements) | |||||
| Decade | Year-0 | Year-1 | Year-2 | Year-3 | Year-4 | Year-5 | Year-6 | Year-7 | Year-8 | Year-9 |
|---|---|---|---|---|---|---|---|---|---|---|
| 1990's | 213 | 216 | ||||||||
| 2000's | 184 | 210 | 132 | 133 | 134 | 124 | 127 | |||
| 2010's | 40 | 35 | 29 | 28 | 28 | 29 | 34 | 39 | 40 | 44 |
| 2020's | 40 | 39 | 51 | 52 | 62 |
| - = No Data Reported; -- = Not Applicable; NA = Not Available; W = Withheld to avoid disclosure of individual company data. |
| Release Date: 6/30/2026 |
| Next Release Date: 7/31/2026 |