|
Download Data (XLS File) |
|
|||||
|
|||||
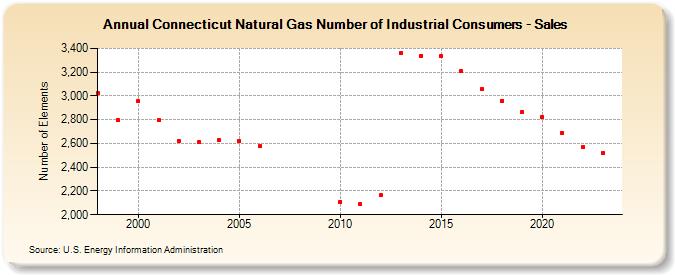
| Connecticut Natural Gas Number of Industrial Consumers - Sales (Number of Elements) | |||||
| Decade | Year-0 | Year-1 | Year-2 | Year-3 | Year-4 | Year-5 | Year-6 | Year-7 | Year-8 | Year-9 |
|---|---|---|---|---|---|---|---|---|---|---|
| 1990's | 3,025 | 2,796 | ||||||||
| 2000's | 2,953 | 2,796 | 2,620 | 2,612 | 2,625 | 2,618 | 2,575 | |||
| 2010's | 2,110 | 2,086 | 2,162 | 3,360 | 3,340 | 3,335 | 3,207 | 3,059 | 2,960 | 2,865 |
| 2020's | 2,822 | 2,689 | 2,572 | 2,518 | 2,395 |
| - = No Data Reported; -- = Not Applicable; NA = Not Available; W = Withheld to avoid disclosure of individual company data. |
| Release Date: 6/30/2026 |
| Next Release Date: 7/31/2026 |