|
Download Data (XLS File) |
|
|||||
|
|||||
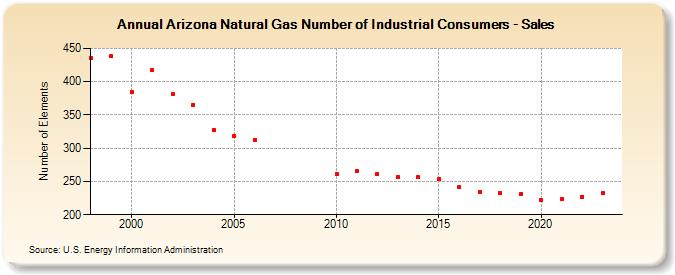
| Arizona Natural Gas Number of Industrial Consumers - Sales (Number of Elements) | |||||
| Decade | Year-0 | Year-1 | Year-2 | Year-3 | Year-4 | Year-5 | Year-6 | Year-7 | Year-8 | Year-9 |
|---|---|---|---|---|---|---|---|---|---|---|
| 1990's | 436 | 438 | ||||||||
| 2000's | 384 | 417 | 381 | 365 | 328 | 319 | 312 | |||
| 2010's | 261 | 266 | 261 | 257 | 256 | 253 | 241 | 234 | 233 | 231 |
| 2020's | 222 | 224 | 227 | 231 | 233 |
| - = No Data Reported; -- = Not Applicable; NA = Not Available; W = Withheld to avoid disclosure of individual company data. |
| Release Date: 6/30/2026 |
| Next Release Date: 7/31/2026 |