|
Download Data (XLS File) |
|
|||||
|
|||||
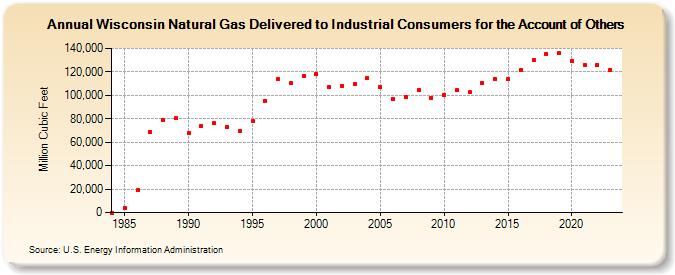
| Wisconsin Natural Gas Delivered to Industrial Consumers for the Account of Others (Million Cubic Feet) | |||||
| Decade | Year-0 | Year-1 | Year-2 | Year-3 | Year-4 | Year-5 | Year-6 | Year-7 | Year-8 | Year-9 |
|---|---|---|---|---|---|---|---|---|---|---|
| 1980's | 0 | 4,082 | 18,946 | 69,080 | 78,618 | 80,400 | ||||
| 1990's | 67,869 | 73,777 | 76,161 | 72,890 | 69,191 | 78,008 | 95,077 | 113,529 | 110,805 | 116,236 |
| 2000's | 118,274 | 107,120 | 108,206 | 109,761 | 114,567 | 106,893 | 96,757 | 98,671 | 104,429 | 98,070 |
| 2010's | 100,284 | 104,268 | 102,447 | 110,518 | 113,845 | 113,721 | 121,766 | 129,870 | 135,541 | 135,807 |
| 2020's | 129,214 | 126,252 | 125,919 | 121,976 | 120,653 |
| - = No Data Reported; -- = Not Applicable; NA = Not Available; W = Withheld to avoid disclosure of individual company data. |
| Release Date: 6/30/2026 |
| Next Release Date: 7/31/2026 |