|
Download Data (XLS File) |
|
|||||
|
|||||
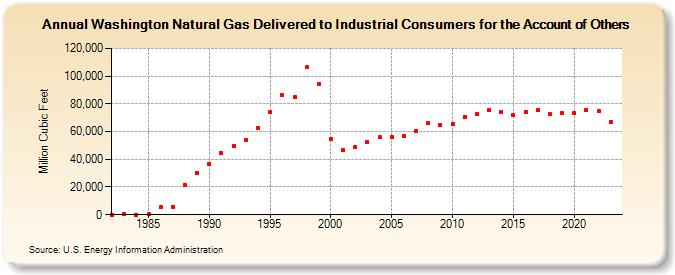
| Washington Natural Gas Delivered to Industrial Consumers for the Account of Others (Million Cubic Feet) | |||||
| Decade | Year-0 | Year-1 | Year-2 | Year-3 | Year-4 | Year-5 | Year-6 | Year-7 | Year-8 | Year-9 |
|---|---|---|---|---|---|---|---|---|---|---|
| 1980's | 80 | 166 | 135 | 712 | 5,270 | 5,834 | 21,620 | 30,274 | ||
| 1990's | 36,929 | 44,526 | 49,911 | 54,177 | 62,877 | 73,798 | 86,332 | 85,079 | 106,345 | 94,481 |
| 2000's | 54,819 | 46,392 | 49,129 | 52,618 | 56,107 | 56,309 | 56,491 | 60,740 | 65,987 | 65,055 |
| 2010's | 65,390 | 70,543 | 72,469 | 75,504 | 74,239 | 71,819 | 74,346 | 75,459 | 72,390 | 73,539 |
| 2020's | 73,274 | 75,669 | 74,812 | 66,999 | 73,611 |
| - = No Data Reported; -- = Not Applicable; NA = Not Available; W = Withheld to avoid disclosure of individual company data. |
| Release Date: 6/30/2026 |
| Next Release Date: 7/31/2026 |