|
Download Data (XLS File) |
|
|||||
|
|||||
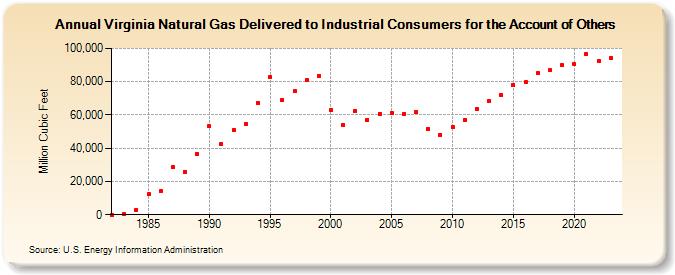
| Virginia Natural Gas Delivered to Industrial Consumers for the Account of Others (Million Cubic Feet) | |||||
| Decade | Year-0 | Year-1 | Year-2 | Year-3 | Year-4 | Year-5 | Year-6 | Year-7 | Year-8 | Year-9 |
|---|---|---|---|---|---|---|---|---|---|---|
| 1980's | 0 | 179 | 2,885 | 12,446 | 14,137 | 28,536 | 25,852 | 36,779 | ||
| 1990's | 53,144 | 42,709 | 51,223 | 54,791 | 67,341 | 83,030 | 69,163 | 74,182 | 80,885 | 83,668 |
| 2000's | 62,839 | 53,955 | 62,654 | 57,149 | 60,726 | 61,106 | 60,628 | 61,617 | 51,804 | 48,098 |
| 2010's | 52,732 | 57,142 | 63,719 | 68,156 | 72,027 | 77,919 | 79,496 | 84,911 | 86,829 | 89,818 |
| 2020's | 90,360 | 96,551 | 92,392 | 94,255 | 90,991 |
| - = No Data Reported; -- = Not Applicable; NA = Not Available; W = Withheld to avoid disclosure of individual company data. |
| Release Date: 6/30/2026 |
| Next Release Date: 7/31/2026 |