|
Download Data (XLS File) |
|
|||||
|
|||||
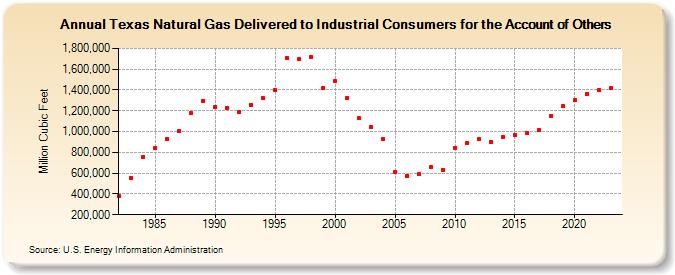
| Texas Natural Gas Delivered to Industrial Consumers for the Account of Others (Million Cubic Feet) | |||||
| Decade | Year-0 | Year-1 | Year-2 | Year-3 | Year-4 | Year-5 | Year-6 | Year-7 | Year-8 | Year-9 |
|---|---|---|---|---|---|---|---|---|---|---|
| 1980's | 378,262 | 557,863 | 759,931 | 839,431 | 924,073 | 1,000,956 | 1,176,854 | 1,298,541 | ||
| 1990's | 1,231,679 | 1,227,979 | 1,190,677 | 1,258,773 | 1,321,308 | 1,402,017 | 1,708,843 | 1,697,267 | 1,717,555 | 1,422,248 |
| 2000's | 1,486,823 | 1,318,504 | 1,126,676 | 1,047,422 | 929,349 | 608,511 | 575,345 | 587,494 | 657,901 | 632,952 |
| 2010's | 842,602 | 892,918 | 925,514 | 900,887 | 946,640 | 970,025 | 988,891 | 1,012,862 | 1,151,111 | 1,242,542 |
| 2020's | 1,299,561 | 1,364,104 | 1,397,702 | 1,417,707 | 1,429,552 |
| - = No Data Reported; -- = Not Applicable; NA = Not Available; W = Withheld to avoid disclosure of individual company data. |
| Release Date: 6/30/2026 |
| Next Release Date: 7/31/2026 |