|
Download Data (XLS File) |
|
|||||
|
|||||
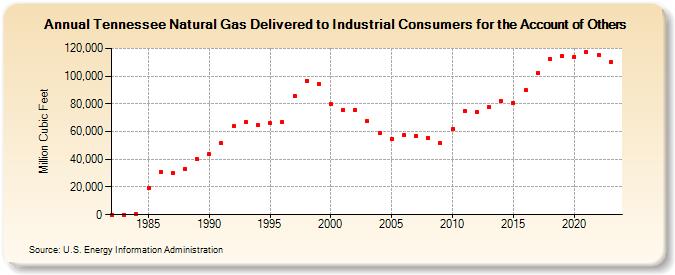
| Tennessee Natural Gas Delivered to Industrial Consumers for the Account of Others (Million Cubic Feet) | |||||
| Decade | Year-0 | Year-1 | Year-2 | Year-3 | Year-4 | Year-5 | Year-6 | Year-7 | Year-8 | Year-9 |
|---|---|---|---|---|---|---|---|---|---|---|
| 1980's | 0 | 0 | 230 | 19,212 | 30,863 | 29,973 | 33,243 | 40,190 | ||
| 1990's | 43,605 | 51,462 | 63,666 | 66,780 | 64,615 | 65,914 | 67,050 | 85,683 | 96,672 | 94,434 |
| 2000's | 79,794 | 75,689 | 75,623 | 67,580 | 58,704 | 54,628 | 57,182 | 56,798 | 55,171 | 51,505 |
| 2010's | 61,819 | 74,878 | 74,139 | 77,689 | 81,862 | 80,649 | 89,681 | 102,218 | 112,531 | 114,757 |
| 2020's | 113,993 | 117,710 | 115,069 | 109,971 | 119,419 |
| - = No Data Reported; -- = Not Applicable; NA = Not Available; W = Withheld to avoid disclosure of individual company data. |
| Release Date: 6/30/2026 |
| Next Release Date: 7/31/2026 |