|
Download Data (XLS File) |
|
|||||
|
|||||
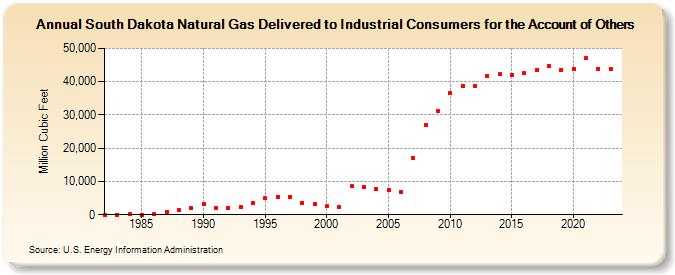
| South Dakota Natural Gas Delivered to Industrial Consumers for the Account of Others (Million Cubic Feet) | |||||
| Decade | Year-0 | Year-1 | Year-2 | Year-3 | Year-4 | Year-5 | Year-6 | Year-7 | Year-8 | Year-9 |
|---|---|---|---|---|---|---|---|---|---|---|
| 1980's | 0 | 0 | 76 | 0 | 164 | 795 | 1,425 | 1,954 | ||
| 1990's | 3,124 | 2,090 | 2,129 | 2,428 | 3,449 | 5,017 | 5,414 | 5,257 | 3,609 | 3,178 |
| 2000's | 2,510 | 2,439 | 8,526 | 8,332 | 7,880 | 7,441 | 6,920 | 17,010 | 26,978 | 31,083 |
| 2010's | 36,630 | 38,776 | 38,689 | 41,767 | 42,158 | 42,146 | 42,557 | 43,635 | 44,772 | 43,629 |
| 2020's | 43,731 | 47,031 | 43,855 | 43,837 | 44,569 |
| - = No Data Reported; -- = Not Applicable; NA = Not Available; W = Withheld to avoid disclosure of individual company data. |
| Release Date: 6/30/2026 |
| Next Release Date: 7/31/2026 |