|
Download Data (XLS File) |
|
|||||
|
|||||
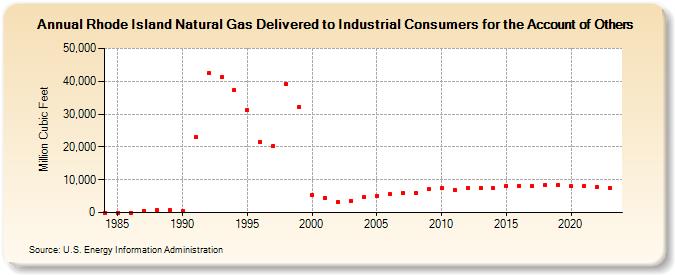
| Rhode Island Natural Gas Delivered to Industrial Consumers for the Account of Others (Million Cubic Feet) | |||||
| Decade | Year-0 | Year-1 | Year-2 | Year-3 | Year-4 | Year-5 | Year-6 | Year-7 | Year-8 | Year-9 |
|---|---|---|---|---|---|---|---|---|---|---|
| 1980's | 0 | 0 | 0 | 566 | 660 | 815 | ||||
| 1990's | 583 | 23,032 | 42,457 | 41,243 | 37,257 | 31,211 | 21,472 | 20,203 | 39,163 | 32,266 |
| 2000's | 5,307 | 4,453 | 3,238 | 3,609 | 4,662 | 4,992 | 5,528 | 5,927 | 5,985 | 7,031 |
| 2010's | 7,513 | 7,018 | 7,345 | 7,424 | 7,357 | 8,156 | 8,193 | 8,236 | 8,446 | 8,441 |
| 2020's | 8,057 | 8,139 | 7,926 | 7,622 | 6,589 |
| - = No Data Reported; -- = Not Applicable; NA = Not Available; W = Withheld to avoid disclosure of individual company data. |
| Release Date: 6/30/2026 |
| Next Release Date: 7/31/2026 |