|
Download Data (XLS File) |
|
|||||
|
|||||
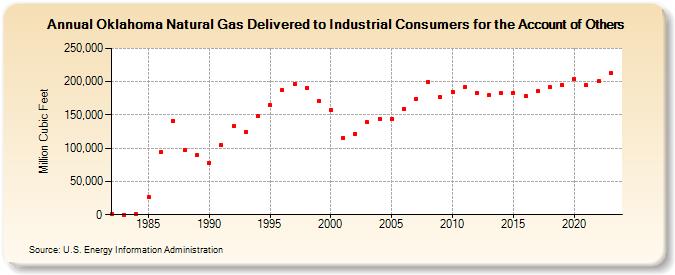
| Oklahoma Natural Gas Delivered to Industrial Consumers for the Account of Others (Million Cubic Feet) | |||||
| Decade | Year-0 | Year-1 | Year-2 | Year-3 | Year-4 | Year-5 | Year-6 | Year-7 | Year-8 | Year-9 |
|---|---|---|---|---|---|---|---|---|---|---|
| 1980's | 468 | 0 | 523 | 26,846 | 93,807 | 141,058 | 97,836 | 89,950 | ||
| 1990's | 78,309 | 104,773 | 133,643 | 124,925 | 148,340 | 164,610 | 187,816 | 197,058 | 190,910 | 170,824 |
| 2000's | 157,368 | 115,831 | 122,015 | 138,891 | 144,557 | 144,247 | 159,498 | 174,227 | 199,676 | 176,721 |
| 2010's | 184,850 | 191,810 | 183,057 | 179,502 | 182,473 | 183,347 | 177,766 | 185,702 | 191,468 | 195,567 |
| 2020's | 203,802 | 194,519 | 200,266 | 212,636 | 211,591 |
| - = No Data Reported; -- = Not Applicable; NA = Not Available; W = Withheld to avoid disclosure of individual company data. |
| Release Date: 6/30/2026 |
| Next Release Date: 7/31/2026 |