|
Download Data (XLS File) |
|
|||||
|
|||||
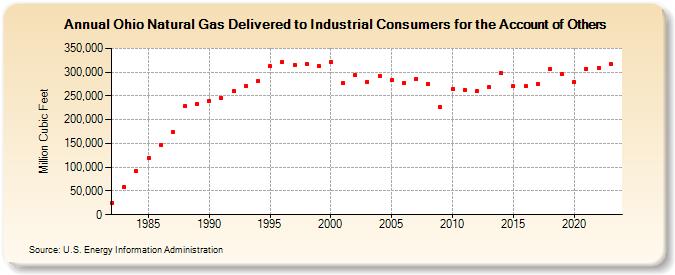
| Ohio Natural Gas Delivered to Industrial Consumers for the Account of Others (Million Cubic Feet) | |||||
| Decade | Year-0 | Year-1 | Year-2 | Year-3 | Year-4 | Year-5 | Year-6 | Year-7 | Year-8 | Year-9 |
|---|---|---|---|---|---|---|---|---|---|---|
| 1980's | 25,069 | 57,827 | 91,136 | 119,347 | 147,617 | 173,127 | 227,745 | 233,517 | ||
| 1990's | 239,551 | 246,062 | 260,609 | 270,667 | 281,055 | 312,067 | 321,733 | 315,694 | 316,960 | 312,688 |
| 2000's | 321,067 | 276,490 | 293,758 | 279,292 | 291,323 | 283,469 | 277,823 | 286,058 | 275,263 | 226,100 |
| 2010's | 263,563 | 262,702 | 260,139 | 267,983 | 297,426 | 270,467 | 269,898 | 275,306 | 306,441 | 295,349 |
| 2020's | 279,566 | 307,183 | 309,294 | 317,133 | 320,449 |
| - = No Data Reported; -- = Not Applicable; NA = Not Available; W = Withheld to avoid disclosure of individual company data. |
| Release Date: 6/30/2026 |
| Next Release Date: 7/31/2026 |