|
Download Data (XLS File) |
|
|||||
|
|||||
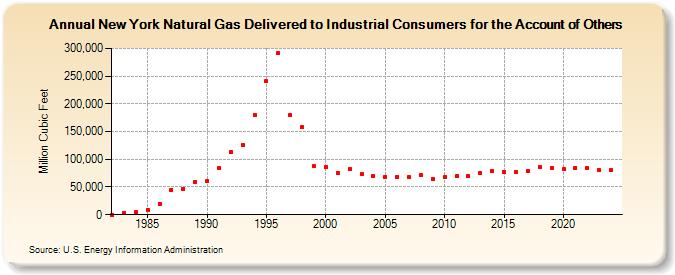
| New York Natural Gas Delivered to Industrial Consumers for the Account of Others (Million Cubic Feet) | |||||
| Decade | Year-0 | Year-1 | Year-2 | Year-3 | Year-4 | Year-5 | Year-6 | Year-7 | Year-8 | Year-9 |
|---|---|---|---|---|---|---|---|---|---|---|
| 1980's | 0 | 2,658 | 4,317 | 8,794 | 19,697 | 45,444 | 47,259 | 58,333 | ||
| 1990's | 60,359 | 83,934 | 113,074 | 125,916 | 180,002 | 240,506 | 291,057 | 179,634 | 157,748 | 87,086 |
| 2000's | 85,604 | 75,335 | 82,130 | 73,686 | 69,928 | 68,851 | 68,718 | 67,770 | 70,815 | 63,752 |
| 2010's | 67,459 | 69,216 | 69,125 | 74,769 | 79,099 | 77,911 | 76,188 | 78,048 | 86,152 | 85,107 |
| 2020's | 81,783 | 85,055 | 84,159 | 80,249 | 79,881 |
| - = No Data Reported; -- = Not Applicable; NA = Not Available; W = Withheld to avoid disclosure of individual company data. |
| Release Date: 6/30/2026 |
| Next Release Date: 7/31/2026 |