|
Download Data (XLS File) |
|
|||||
|
|||||
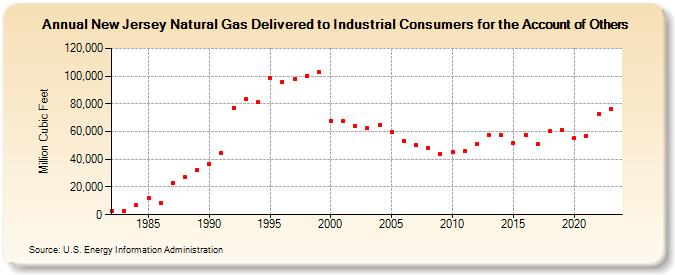
| New Jersey Natural Gas Delivered to Industrial Consumers for the Account of Others (Million Cubic Feet) | |||||
| Decade | Year-0 | Year-1 | Year-2 | Year-3 | Year-4 | Year-5 | Year-6 | Year-7 | Year-8 | Year-9 |
|---|---|---|---|---|---|---|---|---|---|---|
| 1980's | 2,847 | 2,589 | 6,730 | 12,333 | 8,688 | 22,806 | 27,017 | 32,598 | ||
| 1990's | 36,790 | 44,419 | 77,276 | 83,216 | 81,222 | 98,456 | 96,081 | 97,757 | 100,397 | 102,791 |
| 2000's | 67,630 | 67,512 | 63,735 | 62,353 | 64,398 | 59,989 | 52,828 | 50,057 | 48,043 | 44,106 |
| 2010's | 45,217 | 45,797 | 51,226 | 57,725 | 57,456 | 51,582 | 57,712 | 50,730 | 60,291 | 60,833 |
| 2020's | 55,104 | 56,470 | 72,629 | 76,117 | 57,867 |
| - = No Data Reported; -- = Not Applicable; NA = Not Available; W = Withheld to avoid disclosure of individual company data. |
| Release Date: 6/30/2026 |
| Next Release Date: 7/31/2026 |