|
Download Data (XLS File) |
|
|||||
|
|||||
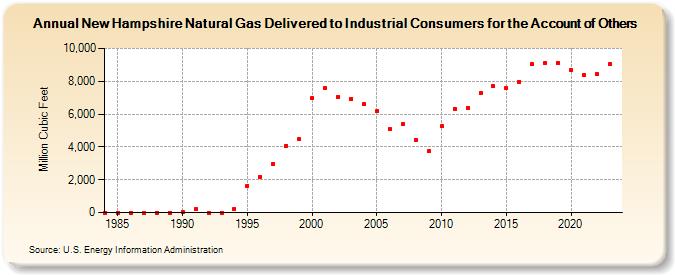
| New Hampshire Natural Gas Delivered to Industrial Consumers for the Account of Others (Million Cubic Feet) | |||||
| Decade | Year-0 | Year-1 | Year-2 | Year-3 | Year-4 | Year-5 | Year-6 | Year-7 | Year-8 | Year-9 |
|---|---|---|---|---|---|---|---|---|---|---|
| 1980's | 0 | 0 | 0 | 0 | 0 | 0 | ||||
| 1990's | 52 | 202 | 0 | 0 | 225 | 1,639 | 2,193 | 2,987 | 4,072 | 4,475 |
| 2000's | 6,989 | 7,559 | 7,066 | 6,935 | 6,597 | 6,160 | 5,096 | 5,366 | 4,421 | 3,722 |
| 2010's | 5,253 | 6,326 | 6,376 | 7,280 | 7,682 | 7,574 | 7,969 | 9,032 | 9,116 | 9,115 |
| 2020's | 8,675 | 8,349 | 8,423 | 9,057 | 9,005 |
| - = No Data Reported; -- = Not Applicable; NA = Not Available; W = Withheld to avoid disclosure of individual company data. |
| Release Date: 6/30/2026 |
| Next Release Date: 7/31/2026 |