|
Download Data (XLS File) |
|
|||||
|
|||||
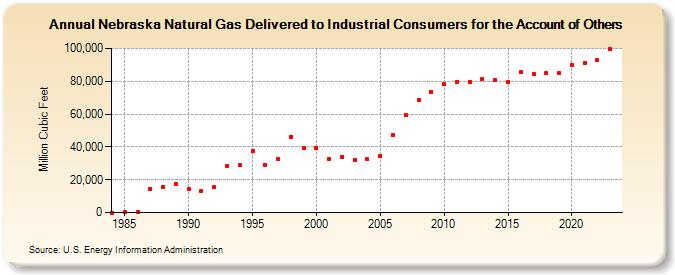
| Nebraska Natural Gas Delivered to Industrial Consumers for the Account of Others (Million Cubic Feet) | |||||
| Decade | Year-0 | Year-1 | Year-2 | Year-3 | Year-4 | Year-5 | Year-6 | Year-7 | Year-8 | Year-9 |
|---|---|---|---|---|---|---|---|---|---|---|
| 1980's | 0 | 257 | 435 | 14,534 | 15,783 | 17,311 | ||||
| 1990's | 14,304 | 13,266 | 15,558 | 28,068 | 28,971 | 37,370 | 28,756 | 32,405 | 46,326 | 39,267 |
| 2000's | 39,628 | 32,906 | 34,085 | 31,832 | 32,460 | 34,285 | 47,186 | 59,260 | 68,507 | 73,700 |
| 2010's | 78,018 | 79,595 | 79,591 | 81,294 | 80,482 | 79,556 | 85,335 | 84,101 | 84,809 | 84,746 |
| 2020's | 89,902 | 91,319 | 92,937 | 99,627 | 103,698 |
| - = No Data Reported; -- = Not Applicable; NA = Not Available; W = Withheld to avoid disclosure of individual company data. |
| Release Date: 6/30/2026 |
| Next Release Date: 7/31/2026 |