|
Download Data (XLS File) |
|
|||||
|
|||||
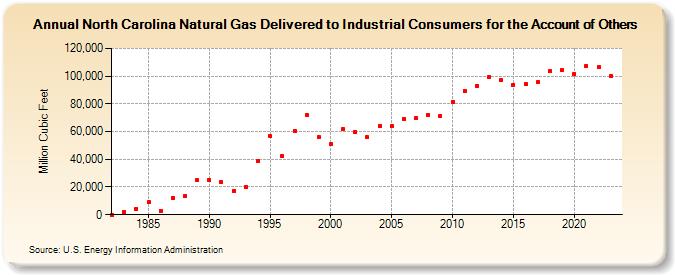
| North Carolina Natural Gas Delivered to Industrial Consumers for the Account of Others (Million Cubic Feet) | |||||
| Decade | Year-0 | Year-1 | Year-2 | Year-3 | Year-4 | Year-5 | Year-6 | Year-7 | Year-8 | Year-9 |
|---|---|---|---|---|---|---|---|---|---|---|
| 1980's | 126 | 1,816 | 4,390 | 8,861 | 2,890 | 12,292 | 13,263 | 24,687 | ||
| 1990's | 24,962 | 23,348 | 17,302 | 20,068 | 38,907 | 56,707 | 42,287 | 60,729 | 72,282 | 56,039 |
| 2000's | 50,946 | 61,746 | 59,782 | 55,805 | 63,897 | 63,866 | 68,993 | 69,622 | 72,288 | 71,072 |
| 2010's | 81,586 | 89,513 | 93,123 | 99,519 | 96,867 | 93,828 | 94,278 | 95,736 | 103,557 | 104,661 |
| 2020's | 101,674 | 107,361 | 106,512 | 99,966 | 98,322 |
| - = No Data Reported; -- = Not Applicable; NA = Not Available; W = Withheld to avoid disclosure of individual company data. |
| Release Date: 6/30/2026 |
| Next Release Date: 7/31/2026 |