|
Download Data (XLS File) |
|
|||||
|
|||||
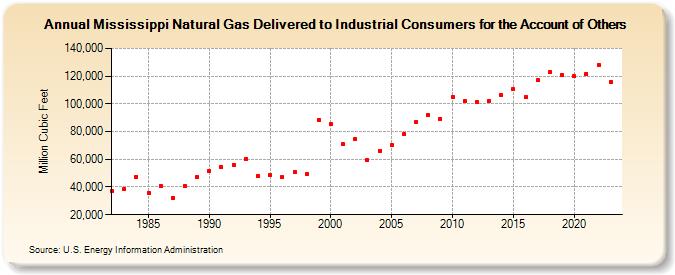
| Mississippi Natural Gas Delivered to Industrial Consumers for the Account of Others (Million Cubic Feet) | |||||
| Decade | Year-0 | Year-1 | Year-2 | Year-3 | Year-4 | Year-5 | Year-6 | Year-7 | Year-8 | Year-9 |
|---|---|---|---|---|---|---|---|---|---|---|
| 1980's | 36,922 | 38,595 | 47,395 | 35,935 | 40,908 | 32,042 | 40,868 | 47,098 | ||
| 1990's | 51,694 | 54,398 | 55,973 | 60,506 | 48,154 | 48,691 | 47,133 | 50,692 | 49,109 | 88,589 |
| 2000's | 85,282 | 70,698 | 74,771 | 59,444 | 66,240 | 69,959 | 78,161 | 87,075 | 92,007 | 89,233 |
| 2010's | 105,001 | 102,034 | 101,237 | 102,074 | 106,268 | 110,355 | 104,881 | 116,945 | 123,012 | 121,026 |
| 2020's | 119,909 | 121,868 | 128,039 | 115,936 | 137,058 |
| - = No Data Reported; -- = Not Applicable; NA = Not Available; W = Withheld to avoid disclosure of individual company data. |
| Release Date: 6/30/2026 |
| Next Release Date: 7/31/2026 |