|
Download Data (XLS File) |
|
|||||
|
|||||
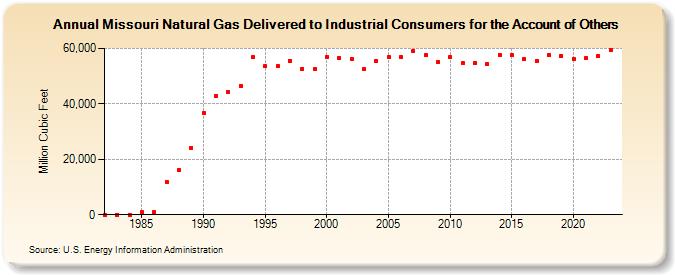
| Missouri Natural Gas Delivered to Industrial Consumers for the Account of Others (Million Cubic Feet) | |||||
| Decade | Year-0 | Year-1 | Year-2 | Year-3 | Year-4 | Year-5 | Year-6 | Year-7 | Year-8 | Year-9 |
|---|---|---|---|---|---|---|---|---|---|---|
| 1980's | 0 | 0 | 35 | 805 | 958 | 11,853 | 16,101 | 24,219 | ||
| 1990's | 36,711 | 42,745 | 44,131 | 46,608 | 56,873 | 53,484 | 53,656 | 55,629 | 52,568 | 52,499 |
| 2000's | 56,959 | 56,676 | 56,247 | 52,442 | 55,583 | 56,956 | 56,970 | 59,192 | 57,483 | 55,067 |
| 2010's | 56,968 | 54,631 | 54,703 | 54,454 | 57,742 | 57,508 | 56,135 | 55,511 | 57,552 | 57,284 |
| 2020's | 56,189 | 56,505 | 57,197 | 59,419 | 61,218 |
| - = No Data Reported; -- = Not Applicable; NA = Not Available; W = Withheld to avoid disclosure of individual company data. |
| Release Date: 6/30/2026 |
| Next Release Date: 7/31/2026 |