|
Download Data (XLS File) |
|
|||||
|
|||||
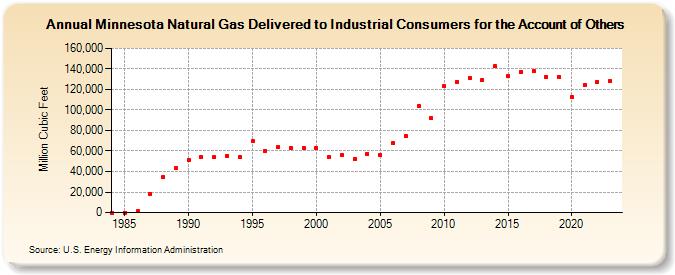
| Minnesota Natural Gas Delivered to Industrial Consumers for the Account of Others (Million Cubic Feet) | |||||
| Decade | Year-0 | Year-1 | Year-2 | Year-3 | Year-4 | Year-5 | Year-6 | Year-7 | Year-8 | Year-9 |
|---|---|---|---|---|---|---|---|---|---|---|
| 1980's | 0 | 0 | 1,192 | 18,382 | 34,281 | 42,966 | ||||
| 1990's | 51,265 | 53,727 | 53,665 | 55,355 | 53,928 | 69,467 | 60,195 | 63,995 | 63,114 | 62,747 |
| 2000's | 63,051 | 53,745 | 56,256 | 52,067 | 57,269 | 55,953 | 67,592 | 74,703 | 104,052 | 91,931 |
| 2010's | 123,042 | 127,364 | 131,416 | 129,344 | 142,437 | 132,972 | 137,299 | 137,599 | 132,303 | 132,189 |
| 2020's | 113,067 | 124,084 | 127,631 | 128,156 | 128,949 |
| - = No Data Reported; -- = Not Applicable; NA = Not Available; W = Withheld to avoid disclosure of individual company data. |
| Release Date: 6/30/2026 |
| Next Release Date: 7/31/2026 |