|
Download Data (XLS File) |
|
|||||
|
|||||
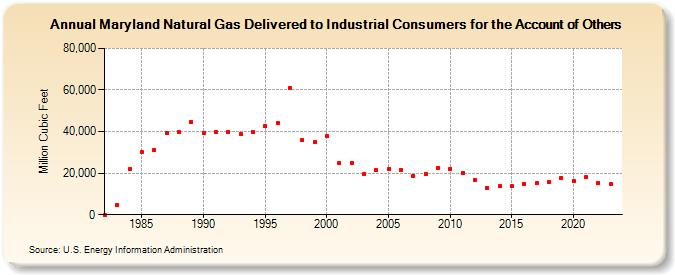
| Maryland Natural Gas Delivered to Industrial Consumers for the Account of Others (Million Cubic Feet) | |||||
| Decade | Year-0 | Year-1 | Year-2 | Year-3 | Year-4 | Year-5 | Year-6 | Year-7 | Year-8 | Year-9 |
|---|---|---|---|---|---|---|---|---|---|---|
| 1980's | 0 | 4,745 | 22,081 | 30,165 | 31,008 | 39,362 | 39,873 | 44,669 | ||
| 1990's | 39,245 | 39,686 | 39,740 | 38,989 | 39,697 | 42,475 | 44,186 | 61,067 | 35,842 | 34,794 |
| 2000's | 37,623 | 25,078 | 25,019 | 19,641 | 21,434 | 21,820 | 21,464 | 18,819 | 19,817 | 22,659 |
| 2010's | 22,143 | 20,042 | 16,729 | 13,032 | 13,656 | 13,644 | 14,788 | 15,120 | 15,568 | 17,698 |
| 2020's | 16,284 | 17,955 | 15,424 | 14,593 | 14,531 |
| - = No Data Reported; -- = Not Applicable; NA = Not Available; W = Withheld to avoid disclosure of individual company data. |
| Release Date: 6/30/2026 |
| Next Release Date: 7/31/2026 |