|
Download Data (XLS File) |
|
|||||
|
|||||
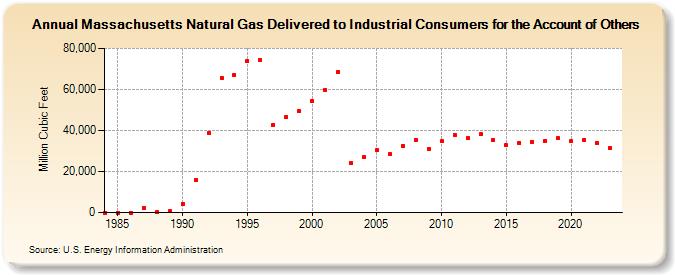
| Massachusetts Natural Gas Delivered to Industrial Consumers for the Account of Others (Million Cubic Feet) | |||||
| Decade | Year-0 | Year-1 | Year-2 | Year-3 | Year-4 | Year-5 | Year-6 | Year-7 | Year-8 | Year-9 |
|---|---|---|---|---|---|---|---|---|---|---|
| 1980's | 0 | 0 | 16 | 2,307 | 254 | 566 | ||||
| 1990's | 4,309 | 15,856 | 38,685 | 65,739 | 67,072 | 73,793 | 74,115 | 42,903 | 46,488 | 49,269 |
| 2000's | 54,442 | 59,822 | 68,719 | 24,077 | 26,891 | 30,359 | 28,410 | 32,486 | 35,480 | 31,079 |
| 2010's | 34,673 | 37,810 | 36,173 | 38,137 | 35,435 | 32,701 | 33,927 | 34,592 | 34,878 | 36,155 |
| 2020's | 34,641 | 35,561 | 34,136 | 31,506 | 32,056 |
| - = No Data Reported; -- = Not Applicable; NA = Not Available; W = Withheld to avoid disclosure of individual company data. |
| Release Date: 6/30/2026 |
| Next Release Date: 7/31/2026 |