|
Download Data (XLS File) |
|
|||||
|
|||||
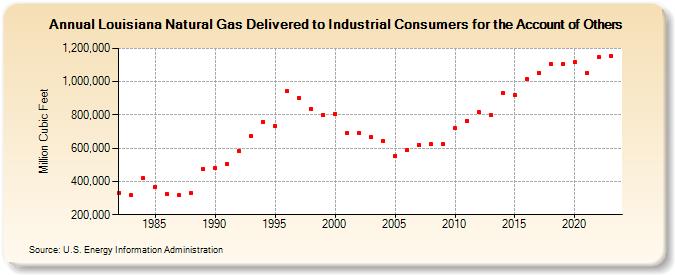
| Louisiana Natural Gas Delivered to Industrial Consumers for the Account of Others (Million Cubic Feet) | |||||
| Decade | Year-0 | Year-1 | Year-2 | Year-3 | Year-4 | Year-5 | Year-6 | Year-7 | Year-8 | Year-9 |
|---|---|---|---|---|---|---|---|---|---|---|
| 1980's | 333,467 | 317,906 | 419,444 | 368,603 | 323,895 | 316,840 | 331,658 | 476,295 | ||
| 1990's | 483,858 | 505,590 | 582,295 | 670,825 | 759,747 | 733,133 | 942,276 | 903,298 | 836,843 | 801,464 |
| 2000's | 808,519 | 690,760 | 688,645 | 667,017 | 642,319 | 554,947 | 589,177 | 621,483 | 622,960 | 622,273 |
| 2010's | 720,764 | 764,547 | 815,132 | 800,371 | 928,837 | 919,579 | 1,015,872 | 1,053,777 | 1,108,710 | 1,107,570 |
| 2020's | 1,119,261 | 1,053,168 | 1,145,333 | 1,154,513 | 1,165,146 |
| - = No Data Reported; -- = Not Applicable; NA = Not Available; W = Withheld to avoid disclosure of individual company data. |
| Release Date: 6/30/2026 |
| Next Release Date: 7/31/2026 |