|
Download Data (XLS File) |
|
|||||
|
|||||
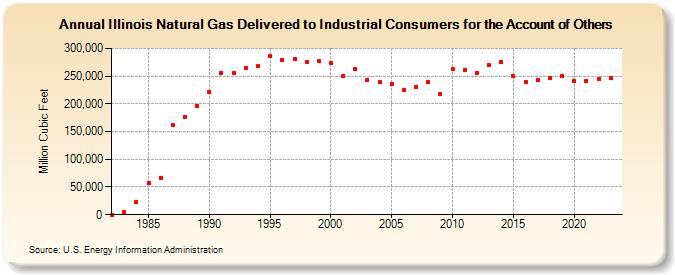
| Illinois Natural Gas Delivered to Industrial Consumers for the Account of Others (Million Cubic Feet) | |||||
| Decade | Year-0 | Year-1 | Year-2 | Year-3 | Year-4 | Year-5 | Year-6 | Year-7 | Year-8 | Year-9 |
|---|---|---|---|---|---|---|---|---|---|---|
| 1980's | 0 | 5,151 | 23,480 | 57,025 | 67,033 | 161,419 | 175,591 | 196,197 | ||
| 1990's | 221,564 | 256,186 | 255,365 | 265,110 | 267,348 | 286,103 | 278,262 | 280,981 | 274,692 | 277,275 |
| 2000's | 273,963 | 249,873 | 263,557 | 243,544 | 239,679 | 235,820 | 224,098 | 230,731 | 239,310 | 217,025 |
| 2010's | 262,249 | 260,894 | 255,714 | 269,206 | 275,375 | 249,648 | 239,243 | 243,385 | 245,701 | 250,109 |
| 2020's | 240,724 | 241,523 | 244,181 | 247,215 | 241,765 |
| - = No Data Reported; -- = Not Applicable; NA = Not Available; W = Withheld to avoid disclosure of individual company data. |
| Release Date: 6/30/2026 |
| Next Release Date: 7/31/2026 |