|
Download Data (XLS File) |
|
|||||
|
|||||
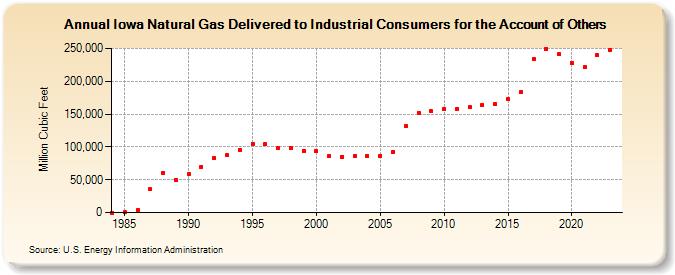
| Iowa Natural Gas Delivered to Industrial Consumers for the Account of Others (Million Cubic Feet) | |||||
| Decade | Year-0 | Year-1 | Year-2 | Year-3 | Year-4 | Year-5 | Year-6 | Year-7 | Year-8 | Year-9 |
|---|---|---|---|---|---|---|---|---|---|---|
| 1980's | 0 | 169 | 3,597 | 35,327 | 60,931 | 49,800 | ||||
| 1990's | 58,222 | 70,066 | 83,004 | 87,613 | 96,016 | 104,993 | 103,757 | 97,880 | 98,177 | 93,837 |
| 2000's | 93,072 | 85,686 | 85,199 | 86,427 | 85,984 | 86,593 | 92,418 | 131,703 | 151,722 | 154,020 |
| 2010's | 157,696 | 158,015 | 160,189 | 163,807 | 164,957 | 172,481 | 182,933 | 234,060 | 249,255 | 241,289 |
| 2020's | 228,432 | 221,226 | 239,438 | 247,550 | 251,077 |
| - = No Data Reported; -- = Not Applicable; NA = Not Available; W = Withheld to avoid disclosure of individual company data. |
| Release Date: 6/30/2026 |
| Next Release Date: 7/31/2026 |