|
Download Data (XLS File) |
|
|||||
|
|||||
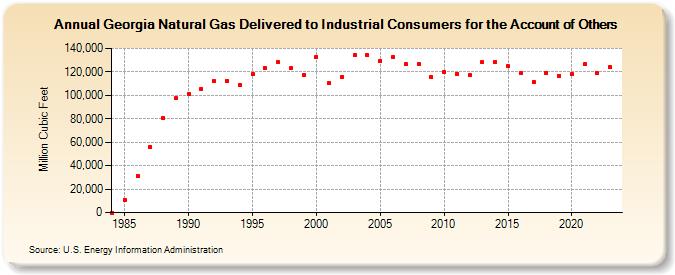
| Georgia Natural Gas Delivered to Industrial Consumers for the Account of Others (Million Cubic Feet) | |||||
| Decade | Year-0 | Year-1 | Year-2 | Year-3 | Year-4 | Year-5 | Year-6 | Year-7 | Year-8 | Year-9 |
|---|---|---|---|---|---|---|---|---|---|---|
| 1980's | 0 | 11,080 | 31,472 | 56,045 | 80,806 | 97,521 | ||||
| 1990's | 101,295 | 105,563 | 111,987 | 112,491 | 108,859 | 118,125 | 123,193 | 128,111 | 122,918 | 117,115 |
| 2000's | 132,620 | 110,451 | 115,662 | 133,984 | 134,175 | 129,439 | 132,527 | 126,340 | 126,503 | 115,572 |
| 2010's | 120,114 | 118,563 | 117,147 | 128,062 | 128,672 | 124,733 | 118,772 | 111,600 | 118,633 | 116,678 |
| 2020's | 117,998 | 126,452 | 118,773 | 124,234 | 124,129 |
| - = No Data Reported; -- = Not Applicable; NA = Not Available; W = Withheld to avoid disclosure of individual company data. |
| Release Date: 6/30/2026 |
| Next Release Date: 7/31/2026 |