|
Download Data (XLS File) |
|
|||||
|
|||||
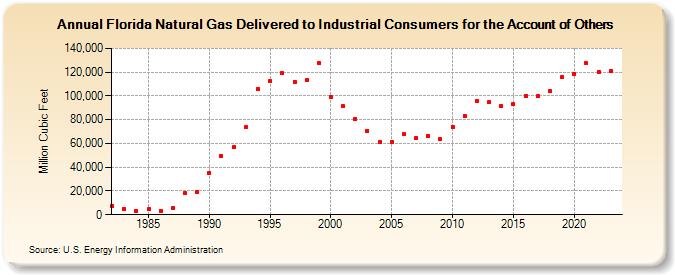
| Florida Natural Gas Delivered to Industrial Consumers for the Account of Others (Million Cubic Feet) | |||||
| Decade | Year-0 | Year-1 | Year-2 | Year-3 | Year-4 | Year-5 | Year-6 | Year-7 | Year-8 | Year-9 |
|---|---|---|---|---|---|---|---|---|---|---|
| 1980's | 7,322 | 5,154 | 3,025 | 4,575 | 3,211 | 5,241 | 18,054 | 19,078 | ||
| 1990's | 34,996 | 49,468 | 56,893 | 73,610 | 106,166 | 112,361 | 119,191 | 112,051 | 113,073 | 127,544 |
| 2000's | 99,211 | 91,146 | 80,364 | 70,510 | 61,251 | 60,973 | 67,567 | 64,393 | 66,256 | 63,383 |
| 2010's | 74,213 | 82,885 | 95,481 | 94,688 | 91,213 | 92,888 | 100,181 | 99,898 | 104,305 | 115,751 |
| 2020's | 118,683 | 127,364 | 120,146 | 121,096 | 122,176 |
| - = No Data Reported; -- = Not Applicable; NA = Not Available; W = Withheld to avoid disclosure of individual company data. |
| Release Date: 6/30/2026 |
| Next Release Date: 7/31/2026 |